Gannet ViewOpen the map

Gannet View

The gannet
knows where.

Now so do you. Currents, temperature breaks, eddies, chlorophyll and the seabed on one map, for any coast, and every number tells you how old it is and how well it has been checked.

From thirty metres up

A gannet can see the fish.

You can't. So Gannet View reads the water for you.

Three things the map reads.

  1. 1The edgeWhere one body of water meets another: how sharp, how far, which way is warm.
  2. 2The currentWhich way the water is moving, how fast, and where streams meet.
  3. 3The colourChlorophyll from satellites, where the water is green and where it is clear.

Then the gannet commits.

Wings folded. No hesitation.

Gannet View is that read,
on a map.

Read the water
The edgeThe currentThe colour
9 kmocean model near every coast, refreshed daily
4 kmchlorophyll and water clarity, worldwide
1 kmsea surface temperature
450 mseabed, worldwide
7 daysof currents ahead, clearly labelled

A gannet looks down and sees the fish. From a boat you can't, so Gannet View reads the water that puts them there, and shows its working: which satellite, which day, how sharp, and whether anyone has checked it against a real instrument.

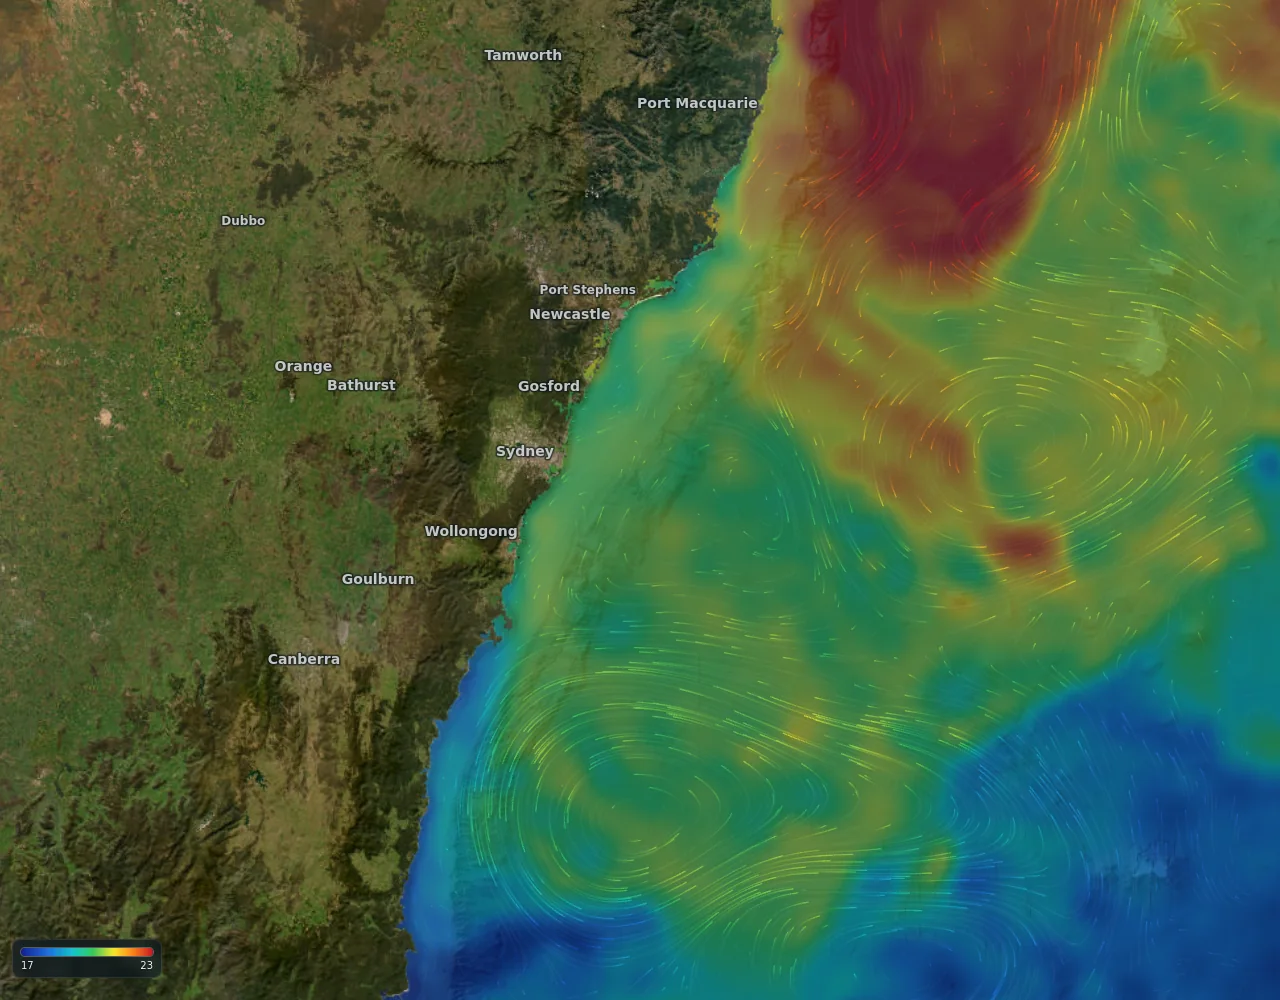
Ocean current streaks over sea temperature off the New South Wales coast

Currents

See the water move.

Offshore currents drawn as living streaks, coloured by temperature, at the same detail whether you are looking at a whole ocean or a single reef. Near the coast the sharper 9 km ocean model takes over from the satellite field, because that is where the satellite goes blind.

More about ocean currents map

  • Satellite-observed current, model forecast out seven days
  • Streak length is speed; tap anywhere for knots and direction
  • Radar-measured currents where we have them (US coasts today)
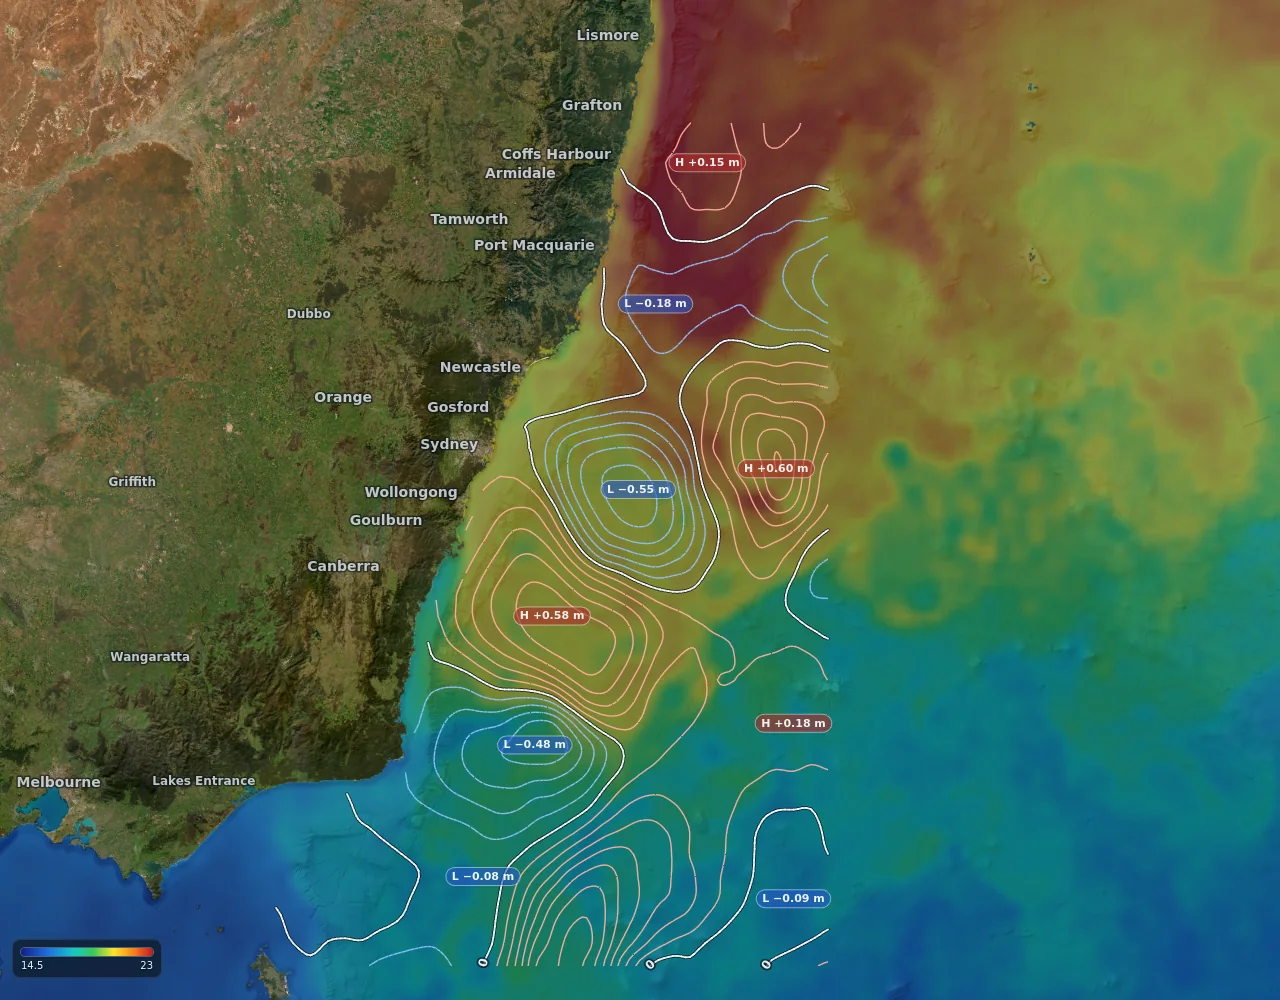
Sea temperature with warm-core and cold-core eddies in the Tasman Sea

Temperature and eddies

Find the break. Find the eddy.

Gannet View draws sea surface temperature at 1 km where the satellites have a clear look, and measures the break for you: how sharp it is, how far away, and which way the warm water lies. Over it, sea level from satellite altimetry marks the warm-core and cold-core eddies that persist for weeks, with their strength written on them.

More about sea temperature, breaks and eddies

  • Colour range you can tighten to the degree that matters today
  • Temperature break distance and slope on every tap
  • High and low tags on every eddy, contours in your units
  • Past passes, and a forecast that fades honestly toward the model
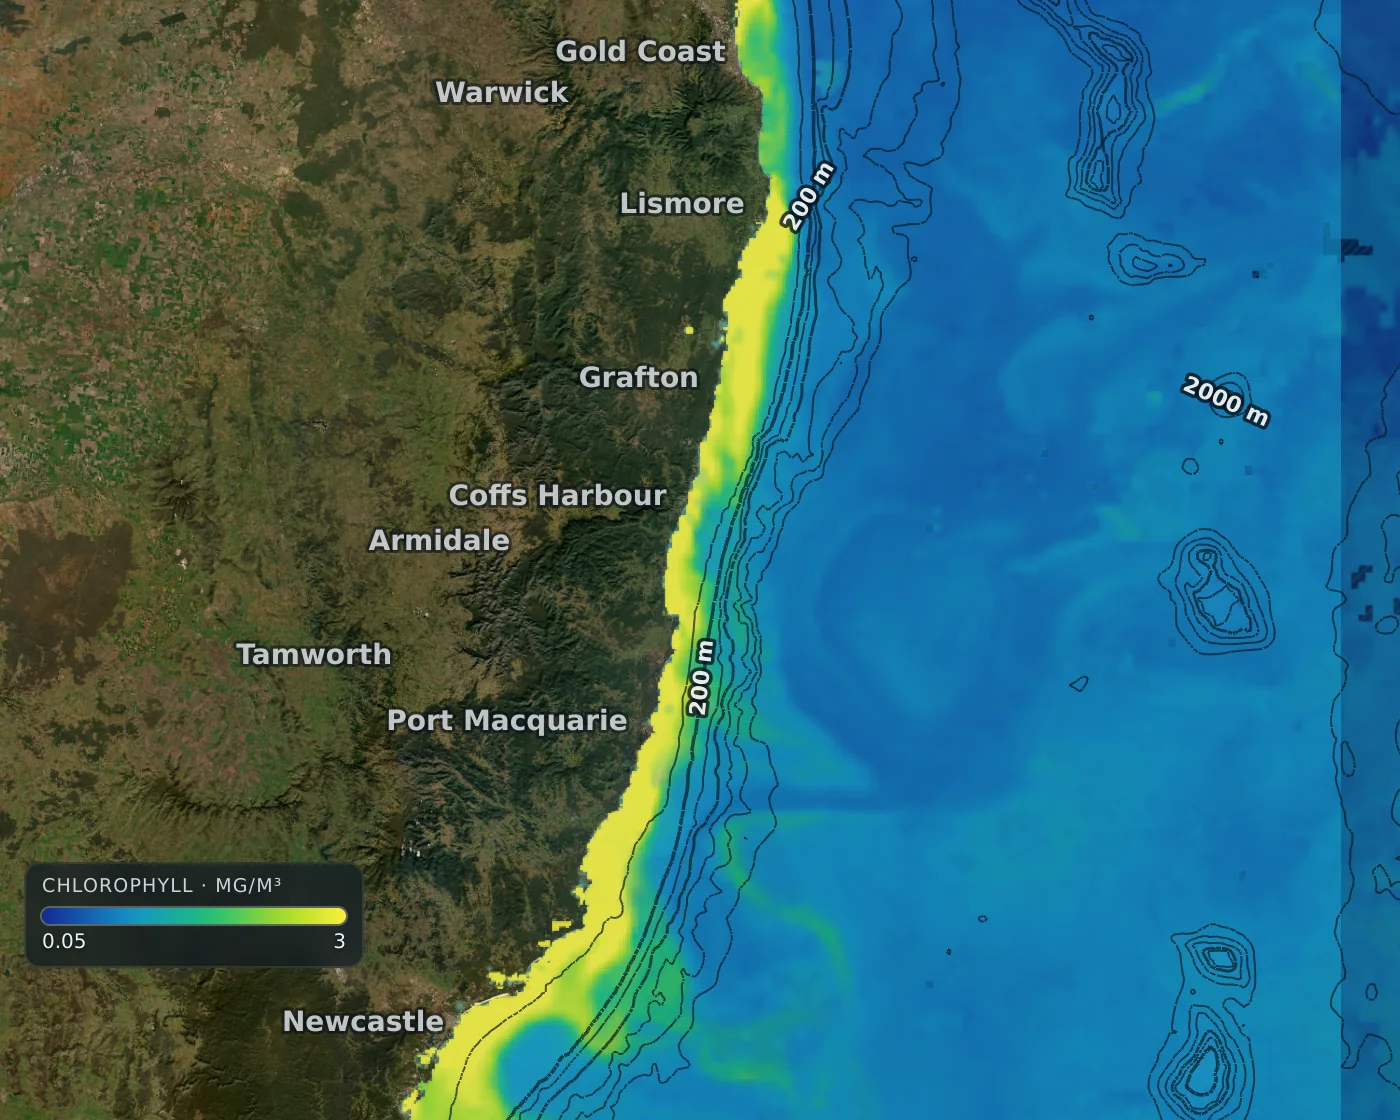
Chlorophyll concentration along the Australian east coast

Chlorophyll and clarity

Follow the green water.

Chlorophyll at about 4 km worldwide, and water clarity as the depth you could see a white disc. Where a satellite saw the water it is drawn solid; where cloud hid it the map shows an estimate, faded and dotted, so nobody mistakes a guess for a measurement.

More about chlorophyll and water clarity

  • Colour key on the map, on a log scale you can read
  • Newest sighting from several satellites, matched to one scale
  • Cloud-hidden water marked as estimate, not painted over
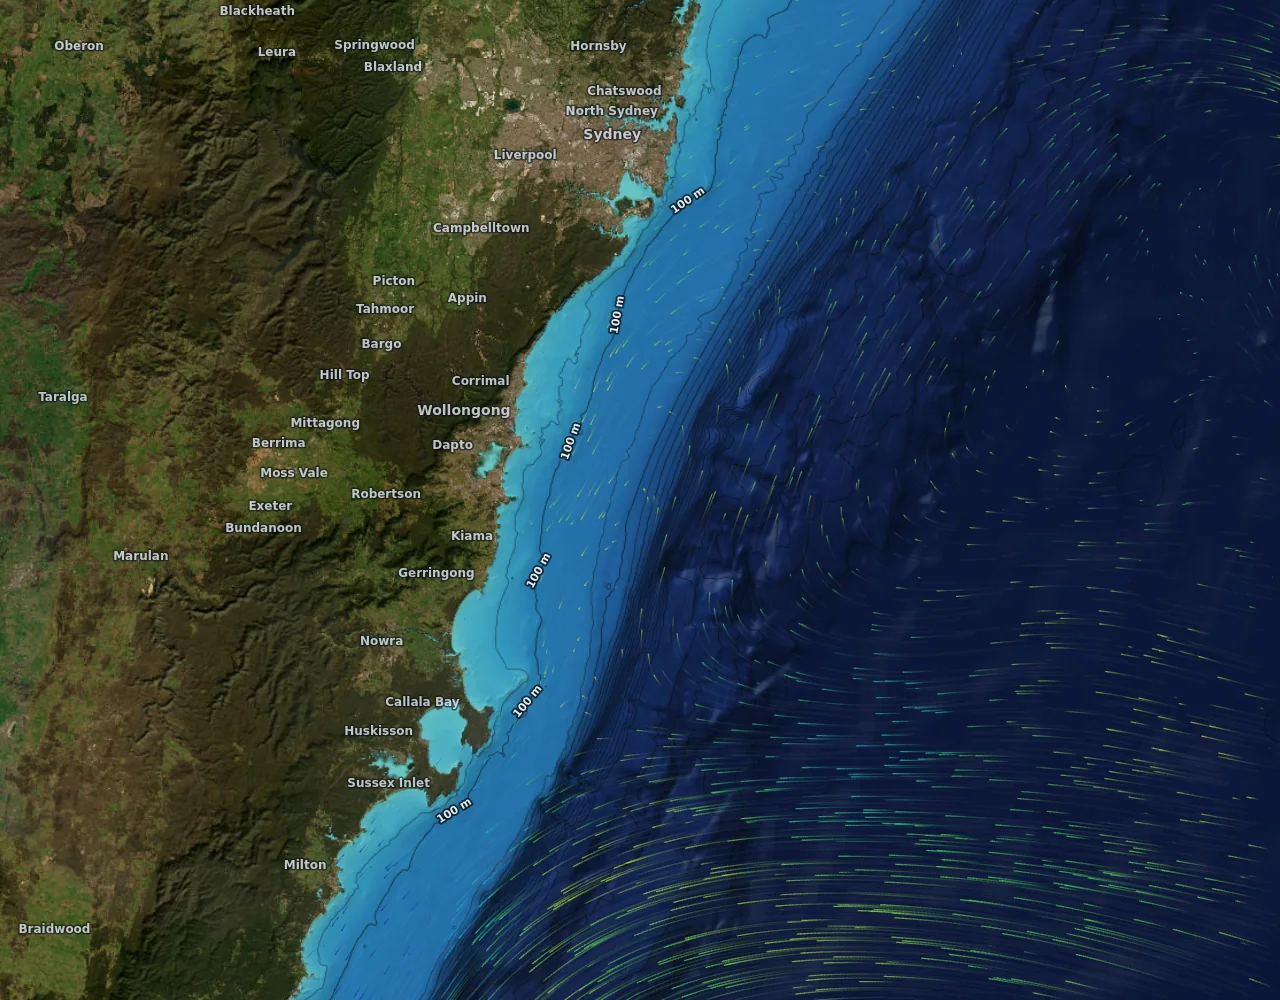
Seabed relief and depth contours with currents off Wollongong

Seabed

The bottom, drawn properly.

Reefs, ledges, the shelf edge and the canyons, as shaded relief and depth contours, worldwide at about 450 metres and much finer on the NSW shelf where multibeam surveys exist. Depth numbers follow your units, and the lines stay still while you zoom.

More about seabed relief and depth

  • Shaded relief with depth lines from 30 m to 2000 m
  • Same depths at every zoom: no lines that shift as you move
  • Tap for the depth under any point

Honest by design

A map you can argue with.

Anglers have been burned by confident colours. So the data comes with its receipts.

Every layer says how old it is.

Not buried in a menu: on the layer, on the tap, on the time bar. A held satellite day says it is held. A forecast day says it is a forecast.

Checked against real instruments.

Our currents were scored against moorings off Batemans Bay, Port Hacking and Sydney and a radar off Newcastle. On the NSW south coast the typical error is about half a knot, and the map tells you that, not just “good”.

Where we have not checked, we say so.

Accuracy is stated per place. Anywhere nobody has measured it yet the map says “not checked in this area” instead of letting a confident colour imply otherwise.

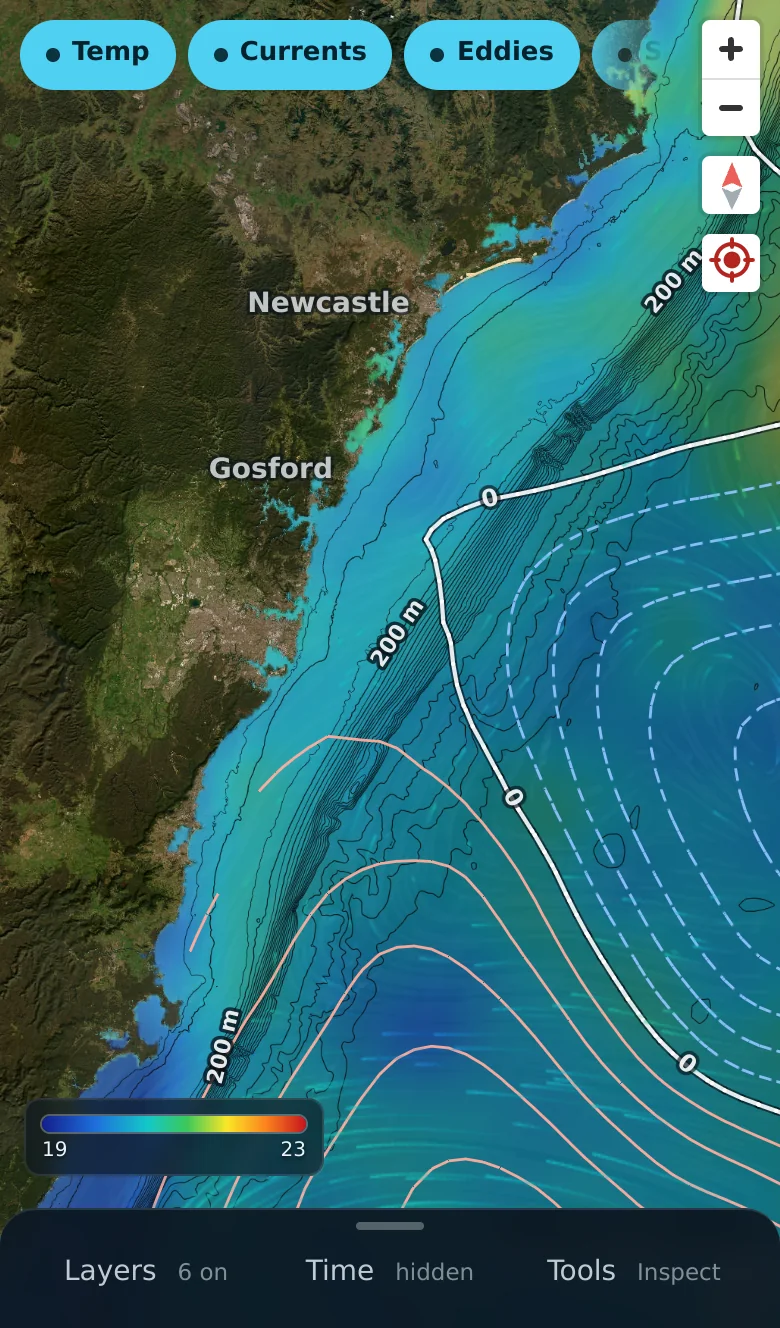
Gannet View on a phone, showing sea temperature and currents with the time bar

Built for the boat

One thumb. Any day.

A time bar with day chips, step buttons and a fine-scrub you control by sliding your finger away from it, so landing on yesterday at noon takes a second. Tap the water anywhere for the temperature, depth, current and the weather at that spot.

  • Measure, Go-here with distance and bearing, and saved spots
  • Your units everywhere: miles or kilometres, feet or metres, degrees C or F
  • Offline packs for the water with no signal

Credit where it is due

Built on the public ocean-observing system.

Gannet View stands on data that space agencies and observing programmes publish for everyone. We stitch it, check it, and explain it.

  • Copernicus Marine Service
  • NOAA CoastWatch and NCEI
  • NASA GIBS, JPL MUR and OB.DAAC
  • IMOS (Integrated Marine Observing System)
  • Geoscience Australia and AusSeabed
  • Esri World Imagery

Questions

Where does the data come from?

Free, open ocean data published by space agencies and marine observing programmes: Copernicus Marine, NOAA, NASA, IMOS, Geoscience Australia and others. Every layer names its source, its date and its grid size on the map.

How current is it?

Satellite ocean colour and sea level run one to a few days behind because that is how long the agencies take to publish them. Sea temperature and currents refresh daily. The map shows the date and age on every layer.

Which coasts does it cover?

The daily layers are worldwide. Detail and checking are strongest on the New South Wales coast, where the first measured accuracy work was done, and we say so everywhere else.

Is it for navigation?

No. Gannet View shows ocean conditions. It is not a navigation chart and must not be used for navigation or safety decisions.

Can I set my own measures?

Yes: nautical miles, kilometres or miles; metres or feet; °C or °F; knots, km/h, mph or m/s. The whole map follows.

Does it work on a phone?

It is built for the boat: one thumb, a time slider you can scrub finely, and a layer chip row. Offline packs for no-signal water are in the app.

Go and look at the water.

Open the map and have a look around.

Open the map