Eddies
Ocean eddy map (sea level)
Satellites measure the height of the sea surface. Highs and lows in that height mark the big, slowly turning eddies that wander through the ocean for weeks.
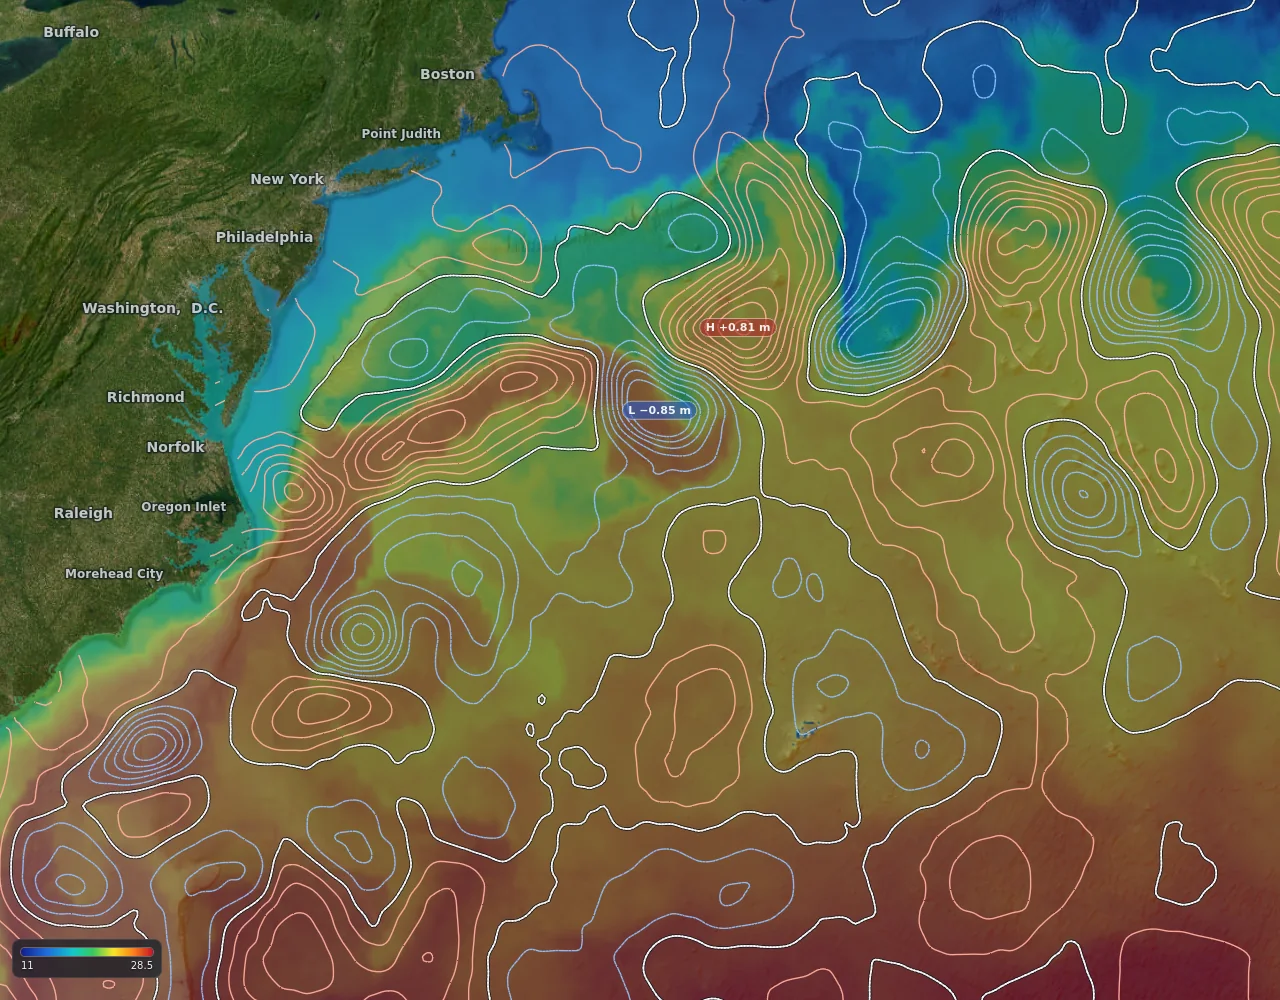
Sea level over sea temperature in the Gulf Stream, from the map.
- A high (H): a warm-core eddy
- A low (L): a cold-core eddy
- Lines close together: the sea surface slopes steeply, so water moves fast
What it shows
- Sea level as contour lines, with every strong high (H) and low (L) tagged with its height.
- Highs and lows mark the big, slow-turning eddies that wander through the ocean for weeks.
- Worldwide.
How to read it
- In the southern hemisphere a high is usually a warm-core eddy and a low a cold-core eddy. In the northern hemisphere it is the other way round for the sense of rotation, but a high is still warm-core.
- Closer-together contours mean the surface slopes faster there, which goes with faster flow around the edge of the eddy.
- Lay it over temperature and currents: an eddy edge often shows up in all three.
Gannet View shows conditions. It does not tell you where fish are, and no layer is a promise of a catch.
How fresh is it?
Updated daily. Worldwide.
Technical details
- Source
- NOAA blended sea level anomaly (satellite altimetry)
- Drawn at
- 0.25 degree grid, contours every 0.1 m; real feature scale about 50 to 100 km
- Age of the data
- About a day or two behind
- We rebuild it
- Rebuilt daily
Limits
- Satellites only pass a spot every few days, so small or fast-moving eddies can be missed or misplaced.
- It is less reliable close to the coast.